Spectrometer
The spectrometer performs a Fourier transform of the incoming light and displays its (frequency) spectrum as a function of wavelength.
If the electric field $E(t)$ enters the spectrometer and we write it using the Fourier transform in the form:
\[ E(t) = \int_0^{+\infty} A(\lambda) \cos \left(\frac{2\pi c}{\lambda}t + \varphi(\lambda) \right) \, d\lambda, \]
then the spectrometer displays the function $A^2(\lambda)$ on the screen.
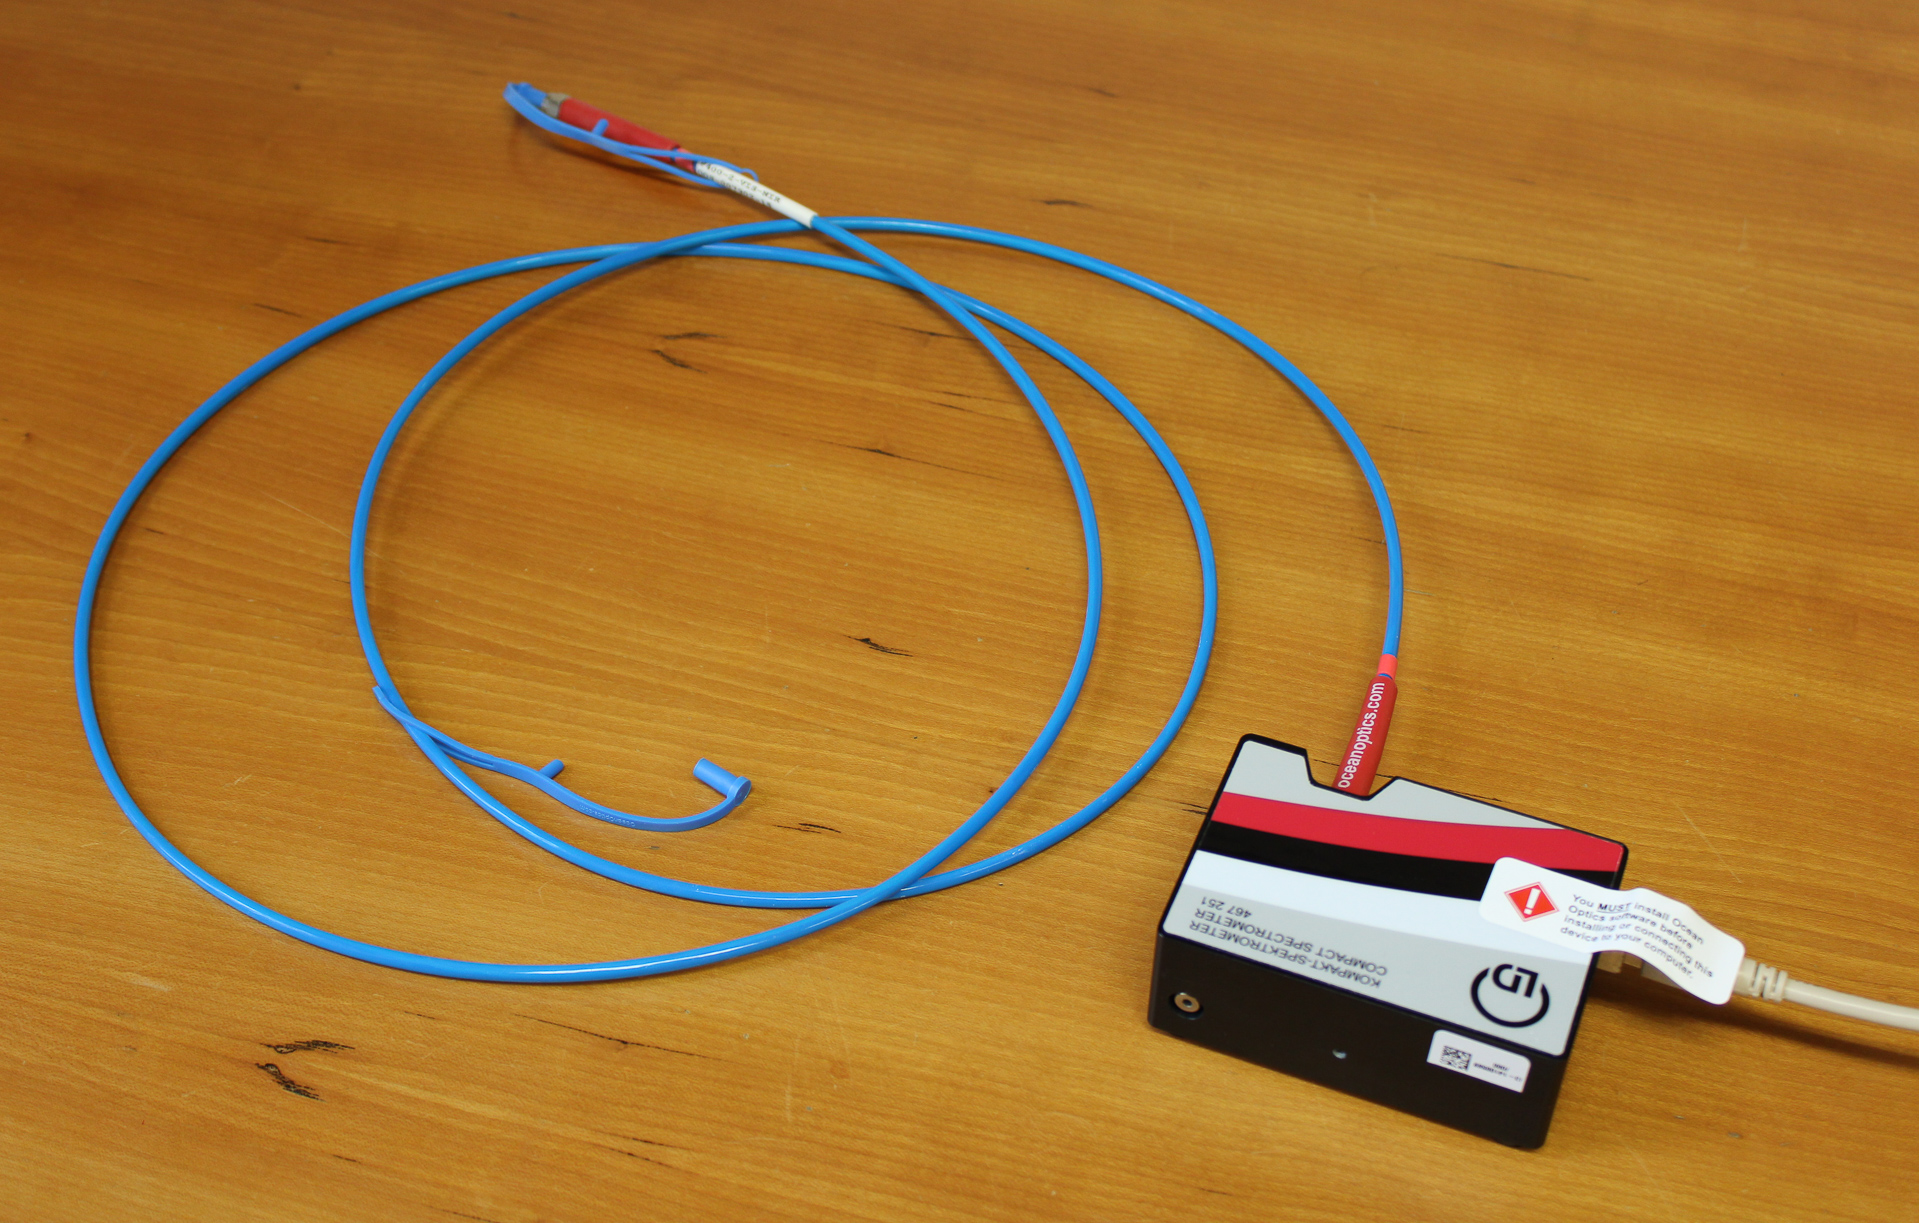
Spectrometer with connected optical fiber.
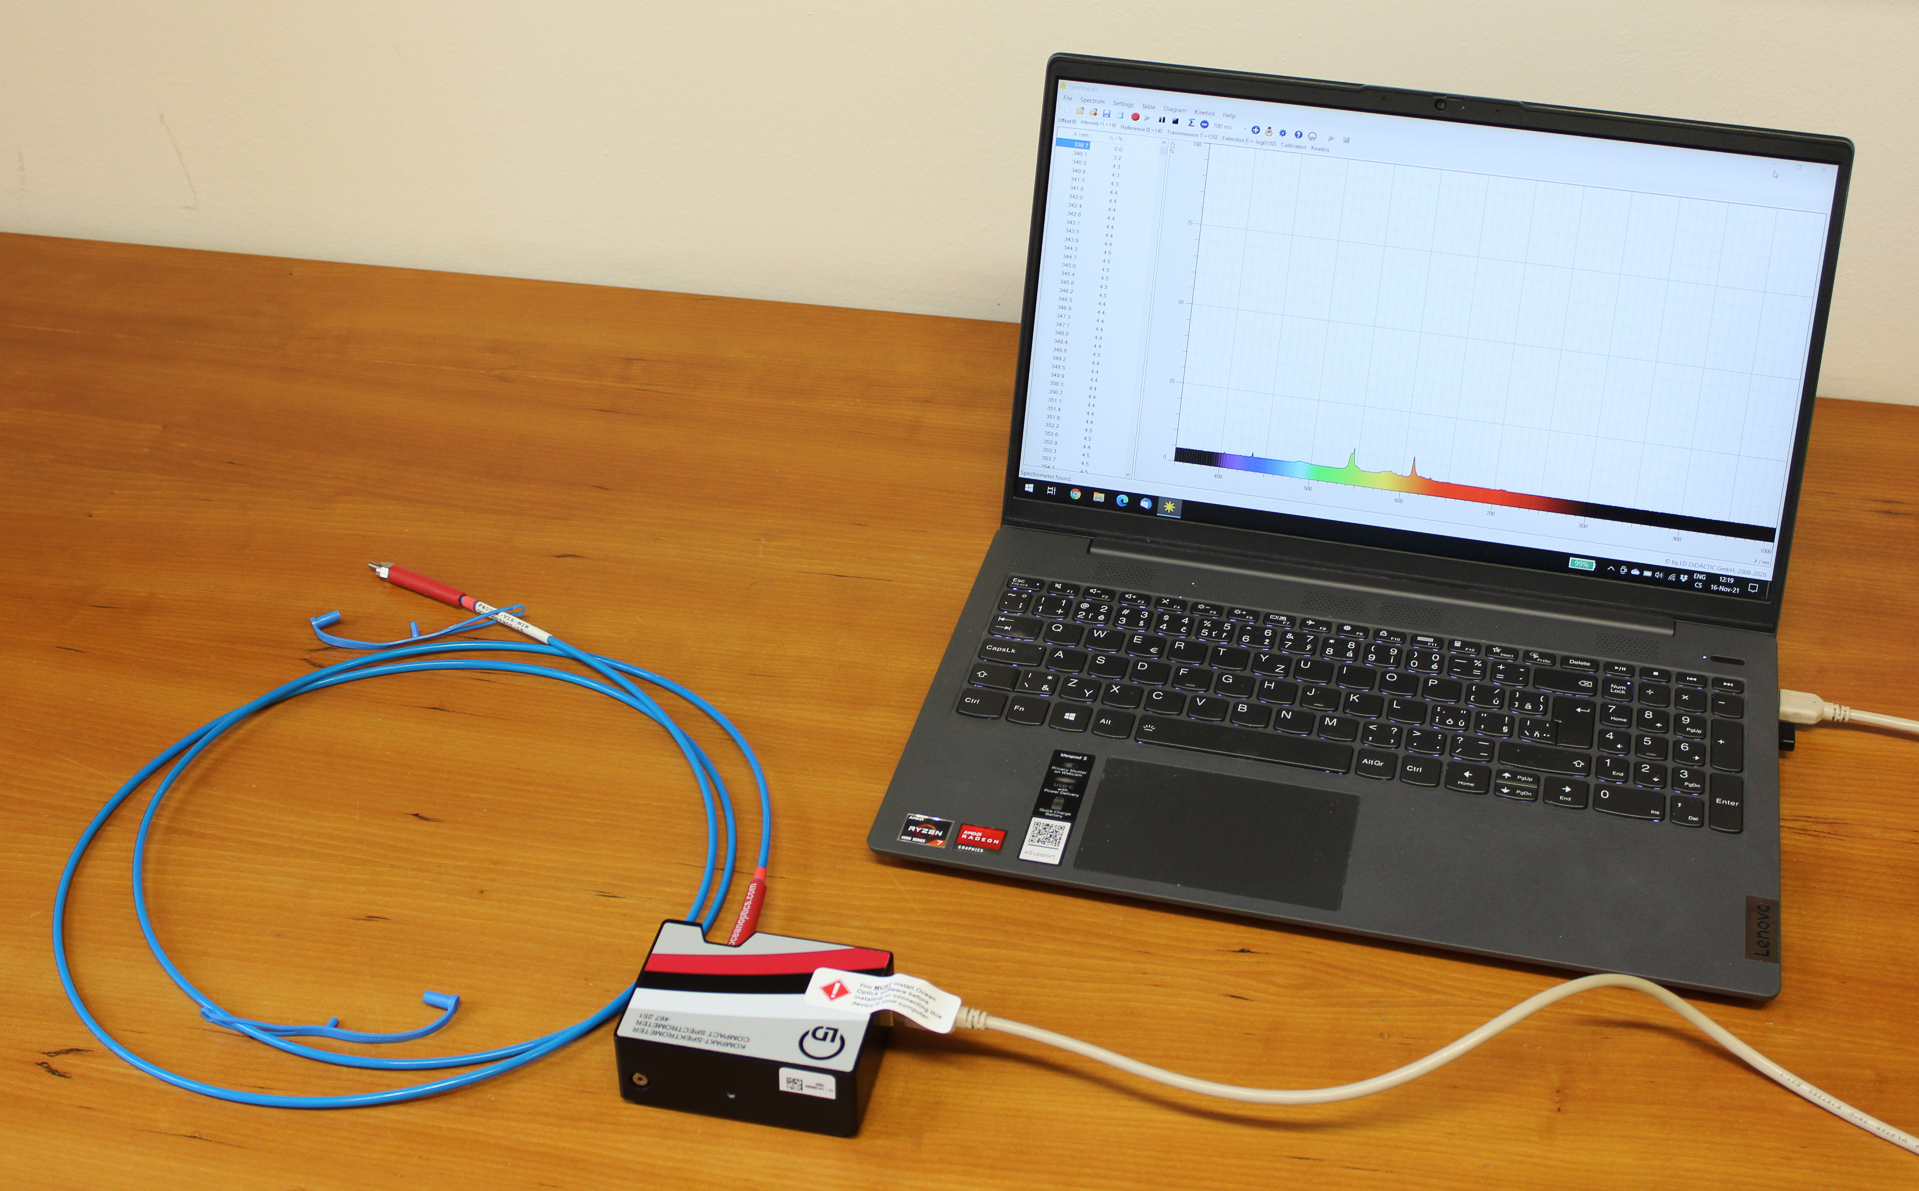
SpectraLab program displaying the spectrum of light entering the spectrometer.
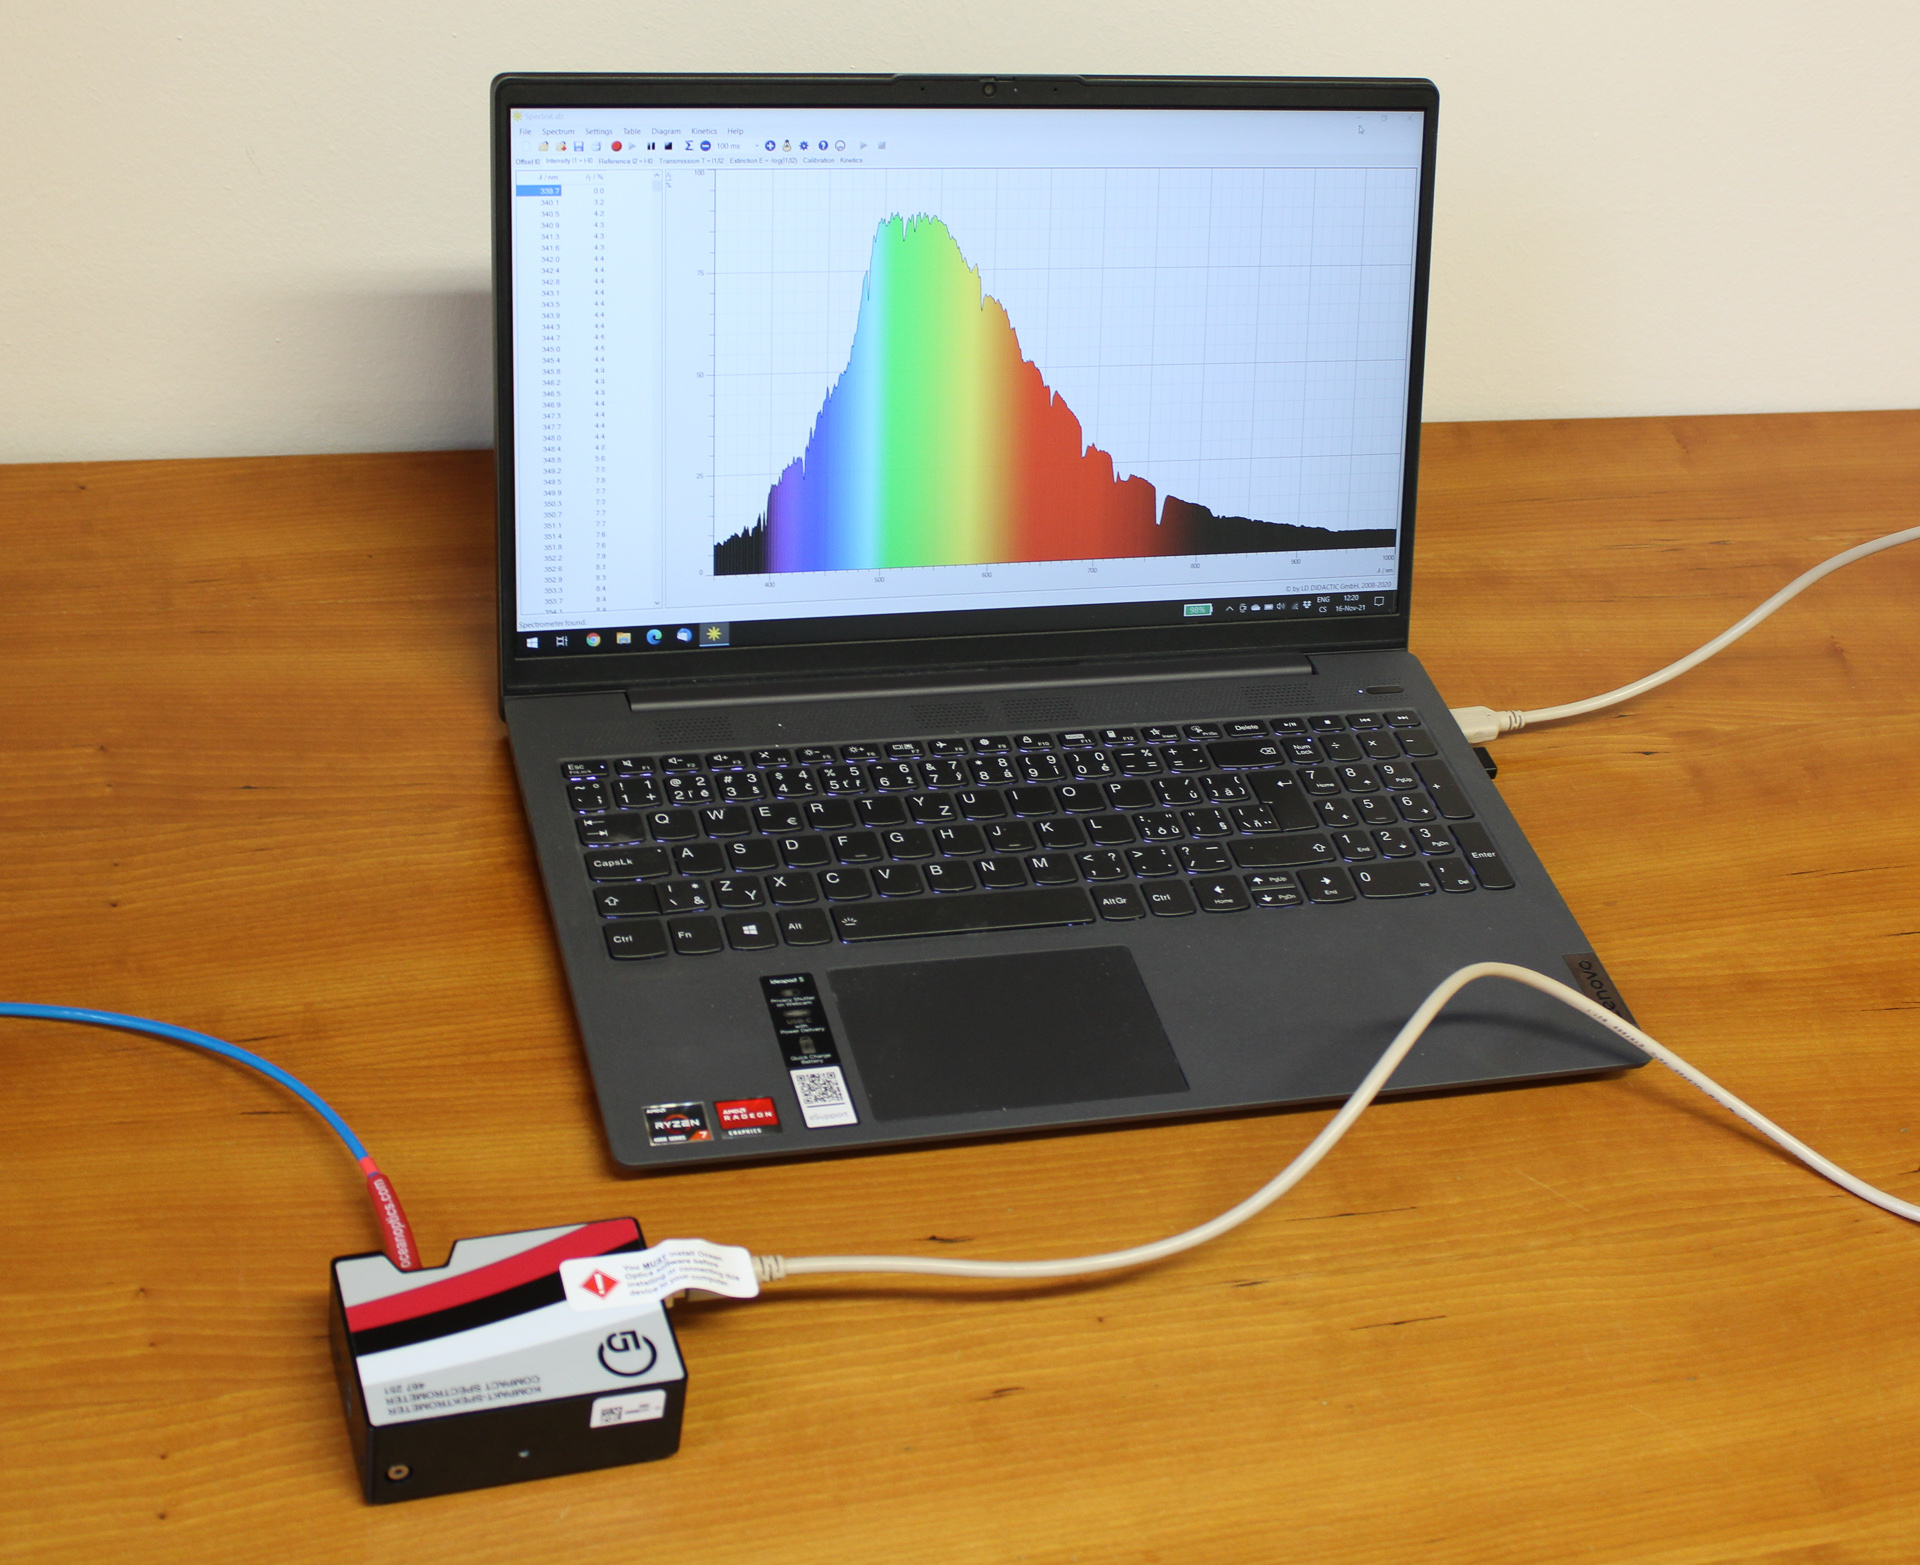
Spectrum of daylight.
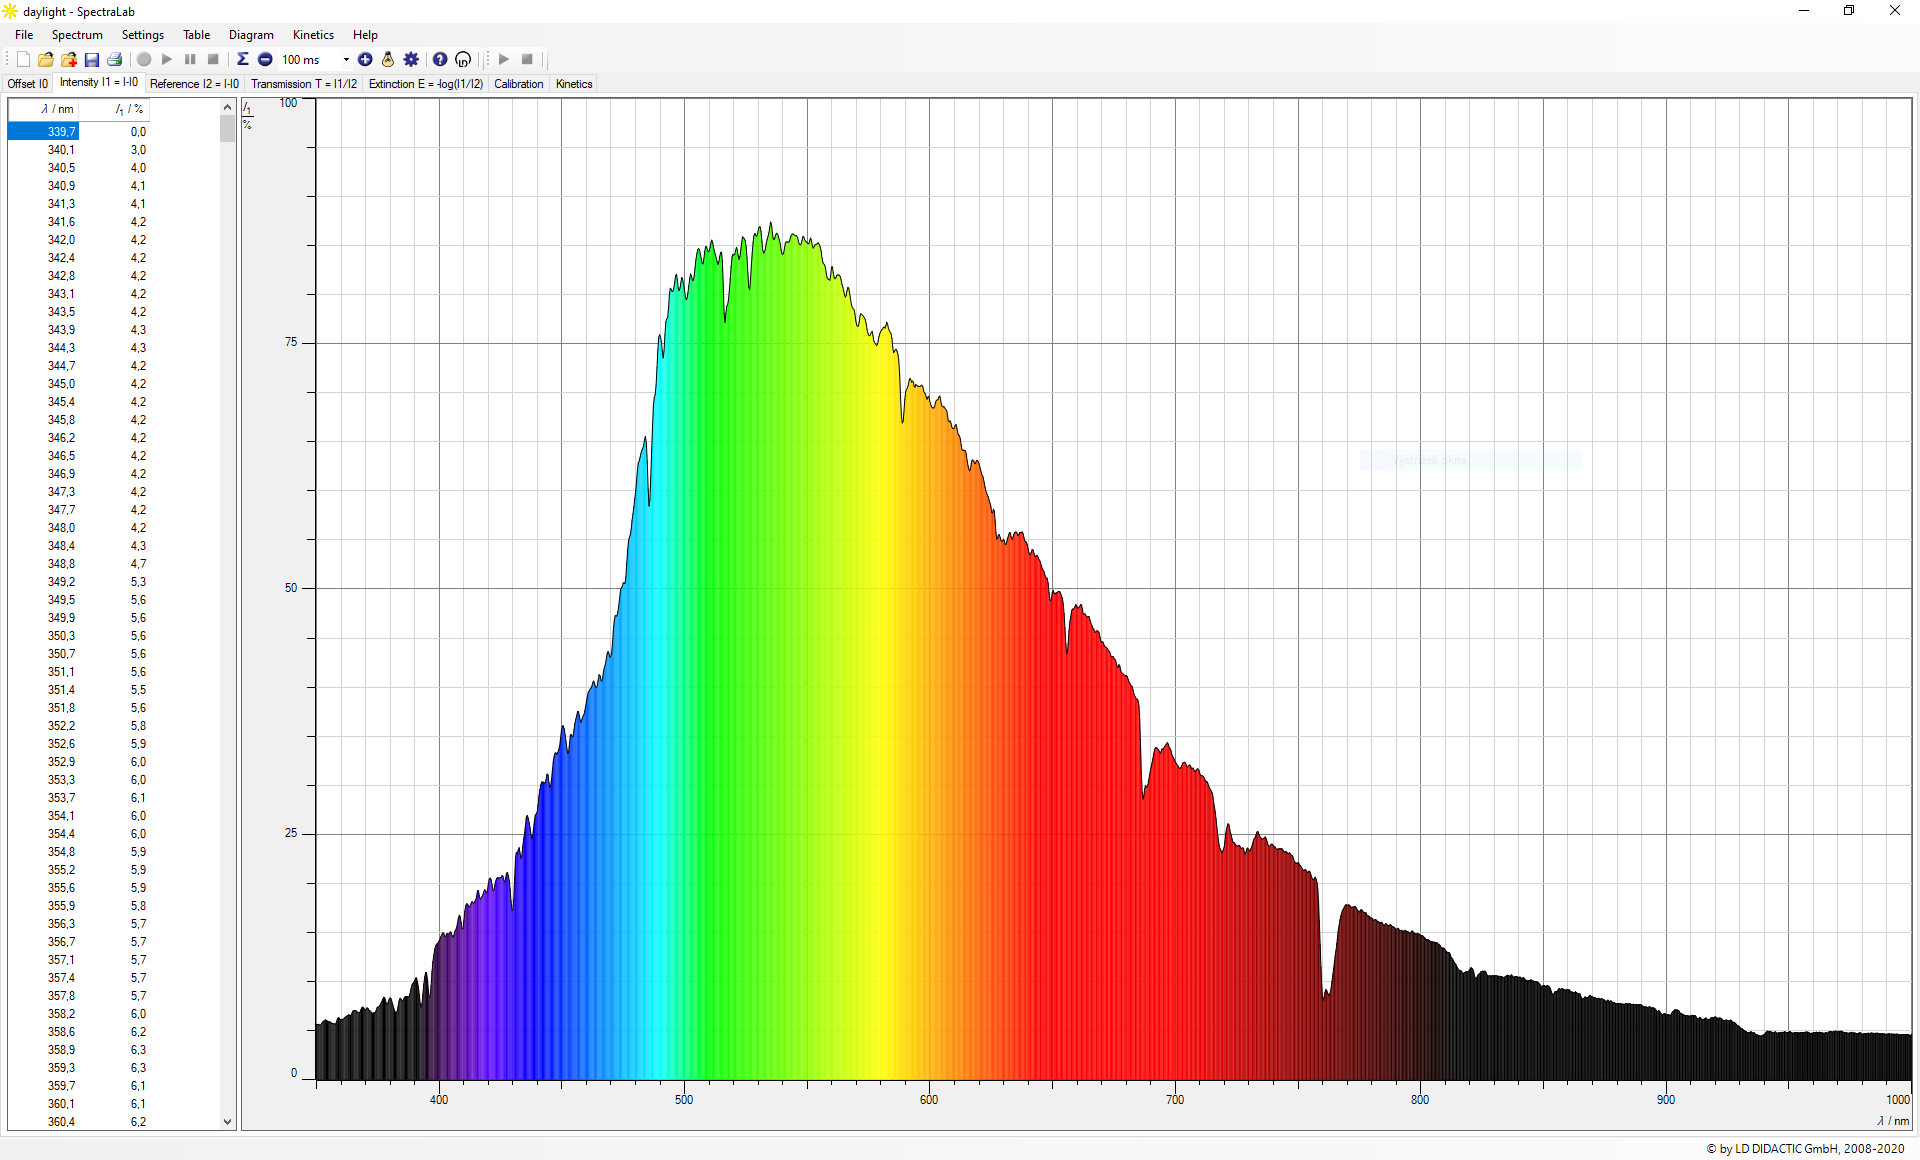
Screenshot of daylight spectrum.